As a tech leader, you’ll make decisions multiple times daily. Some of these can be simple decisions and others more impactful.
Leadership decisions impact everyone working in your team, so it is critical that you have proven tools in your arsenal.
There are two effective decision-making tools.
- Decision matrix
- Decision trees
Let’s start with the first one.
#1 Decision Matrix
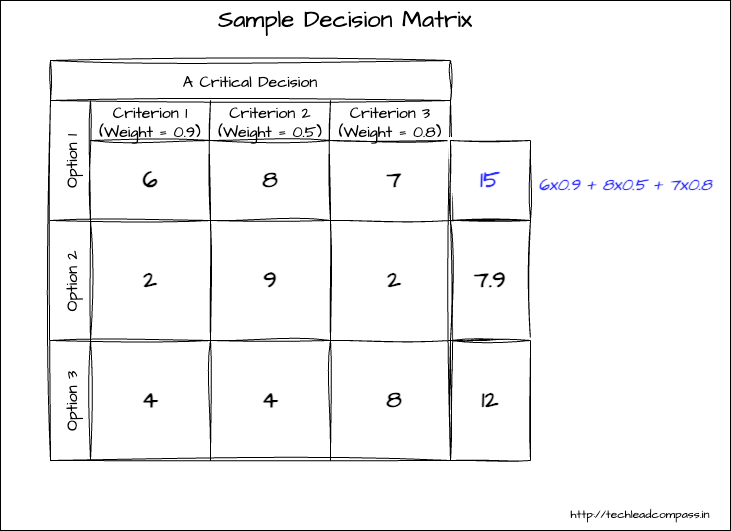
A decision matrix is a decision-making table you can use to evaluate different options
It is a fairly straightforward tool when you have a set of choices and criteria to evaluate them.
How to create a decision matrix?
- Define your goal or problem statement
- Make a list of options
- Define the criteria against which each option must be evaluated
- Assign weights to each criterion based on their importance (higher weight refers to higher importance)
- Score each option against every criterion (thus creating a table or matrix)
- Calculated weighted score for each option (by multiplying raw score with the weight for each entry)
- Compare the total weighted score for options
The option with the highest weighted score is most probably the better decision to go with.
Here’s a sample decision matrix.

However, a decision matrix is not very useful when the options or criteria have relationships between them.
For example, a criterion might be more important when combined with another one and not otherwise.
That’s when you need to use a decision tree.
#2 Decision tree
A decision tree is a map of the possible outcomes of a series of related choices.
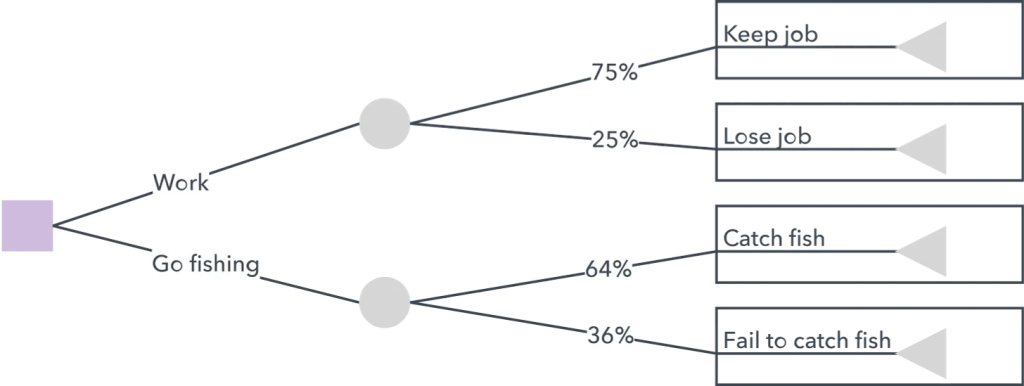
A decision tree has 3 components:
- A decision node represents a decision to be made (typically represented as squares)
- A chance node shows the probability of certain results (typically represented as circles)
- An end node shows the outcome of a given path (typically represented as triangles)
Here’s a fairly simple decision tree that helps you decide what to do on a given day.

How to draw a decision tree:
- Start with the major decision to be made (e.g., buy a house or not)
- Add chance and decision nodes to expand the tree
- Include the probability and the cost of each option, to make a numerical decision
- Continue to expand until each line reaches an end
- Calculate the expected value (EV) of each line. The one with the highest EV is the better path to take
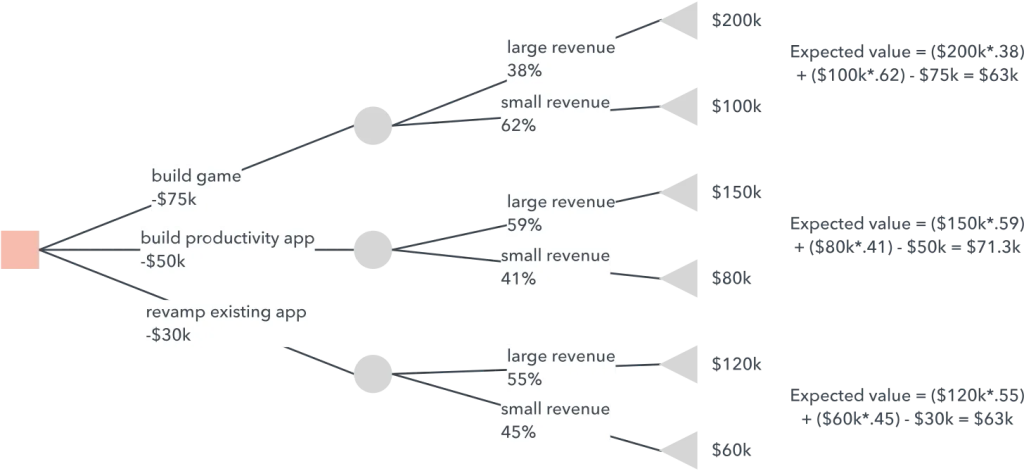
Here’s an example decision tree for a company deciding on “what app to build next”.

In the above example:
- A company has to choose between 3 choices as their next app to build
- Build a gaming app (costing $75k)
- Build a productivity app (costing $50k)
- Revamp existing app (costing $30k)
- For each of these choices, there are forecasted revenues and the probability of achieving them
- Expected value (EV) of revenue is the probabilistic sum of all choices in the path and the cost
Here’s an excellent article from Lucidchart on how to draw a decision tree.
One drawback is that decision trees can become more complex as you add more choices and probabilities. That’s when something like an influence diagram helps – but we will reserve it for another day.
Hopefully, this post has given you some solid tools for your next big decision.
Leave a Reply