Building AI agents in an enterprise extends far beyond prototypes and POCs. When designing agents for real users who drive revenue, governance becomes critical.
This post explores the essential governance pillars for integrating AI agents into enterprise production applications.
In the world of Agent Management Platforms, four governance pillars strengthen the successful rollout of AI agents in your organization.
Short on time? Check the TL;DR
Pillars of AI Agents Governance
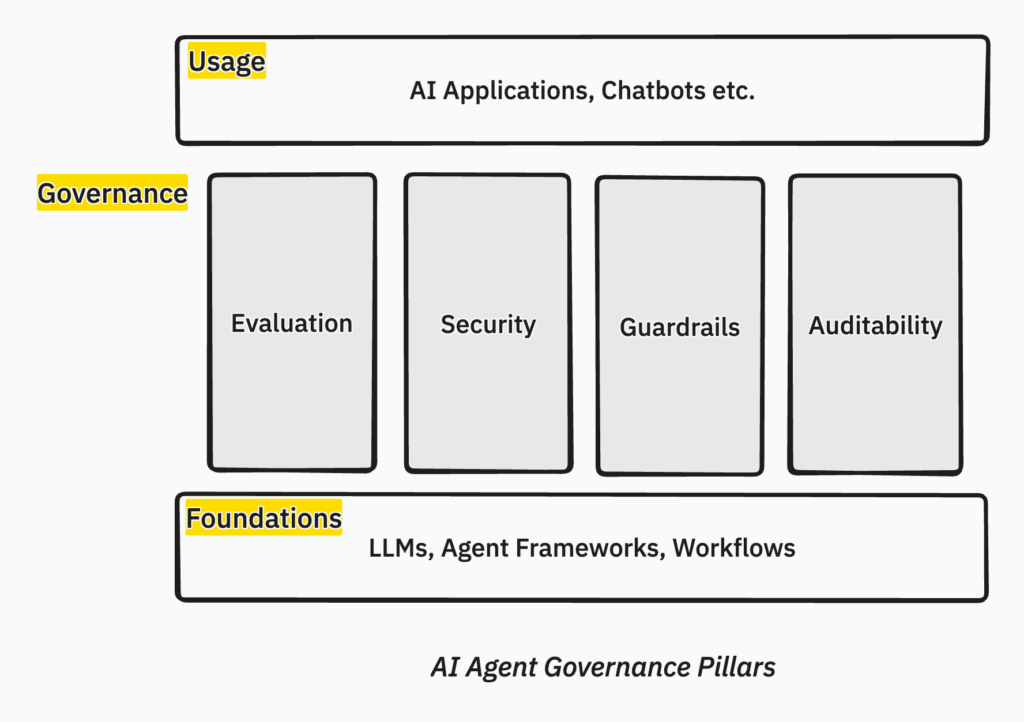
- Evaluation – How do you evaluate the correctness and completeness of agent outputs
- Security – How do you protect agents against malicious attacks and breaches
- Guardrails – How do you set boundaries and checkpoints, often tied to your business and compliance rules
- Auditability – How do you understand everything that has gone on before an agent produced the outputs
For this article, I will pick examples of each pillar from the open-source CrewAI Agentic framework. But you can essentially implement it with other similar frameworks like LangGraph, Mastra, etc.
AI Agents Evaluation
Evaluation in AI agent systems serves a similar purpose to testing in traditional software development—validating that the system performs as intended.
However, AI agents built on large language models are non-deterministic systems. Unlike conventional software, where the same input consistently produces the same output, AI agents may generate different responses across multiple runs. This variability requires specialized evaluation approaches.
Understanding Non-Deterministic Behavior
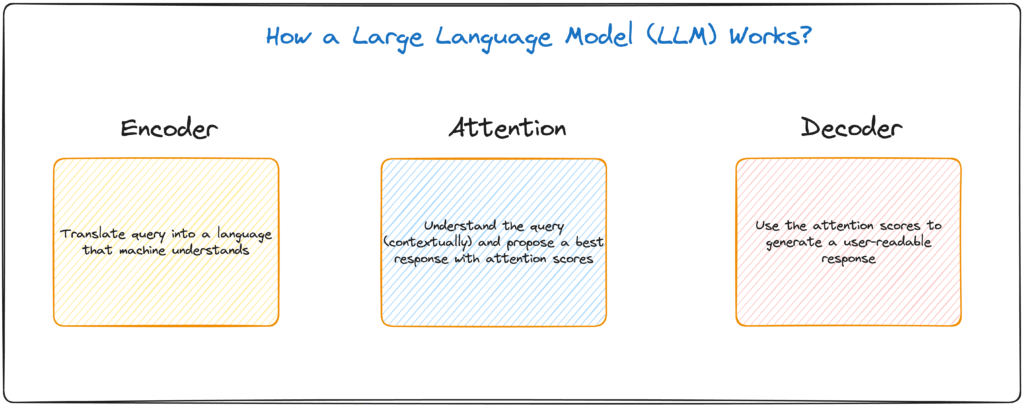
The non-deterministic nature of LLM-based agents stems from temperature settings, sampling methods, and the probabilistic nature of language generation.
While this enables creative problem-solving and natural interactions, it means traditional unit tests with exact output matching are insufficient. Instead, evaluation must assess whether outputs meet quality standards and functional requirements rather than matching predetermined values.
Two Complementary Evaluation Approaches
Effective AI agent evaluation employs two methodologies: subjective and objective evaluation.
Subjective Evaluation: LLM-as-Judge
Subjective evaluation leverages other LLMs to review, critique, and score agent outputs. This approach assesses qualities difficult to measure programmatically, such as relevance, coherence, helpfulness, and tone.
An LLM judge evaluates whether an agent’s response appropriately addresses the user’s intent, maintains a consistent persona, or demonstrates sound reasoning.
The judge receives the original task, the agent’s output, and specific evaluation criteria. It then generates a critique and assigns scores, revealing subtle issues like logical inconsistencies or inappropriate confidence levels that traditional metrics might miss.
Objective Evaluation: Gold Standard Comparison
Objective evaluation relies on gold standard datasets—curated collections of inputs paired with known correct outputs. The process compares agent outputs against these benchmarks using quantifiable metrics such as accuracy, precision, recall, or task-specific success criteria.
For example, if an agent extracts structured information from documents, objective evaluation measures how accurately it identifies required fields compared to human-annotated examples.
For multi-step workflows, evaluation verifies that the agent completes all necessary steps in the correct sequence.
Implementation in Practice
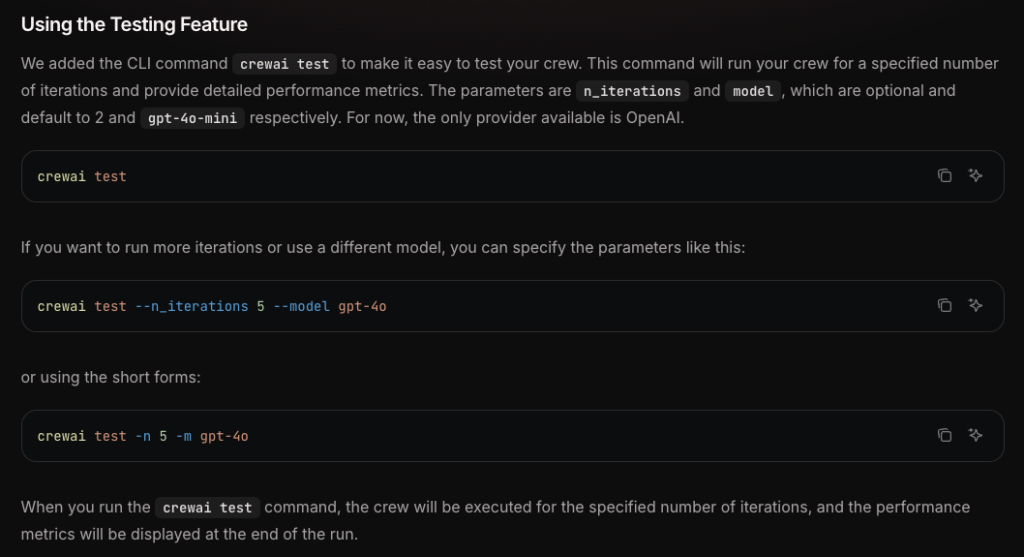
Modern agent frameworks like CrewAI provide built-in evaluation capabilities combining both approaches.
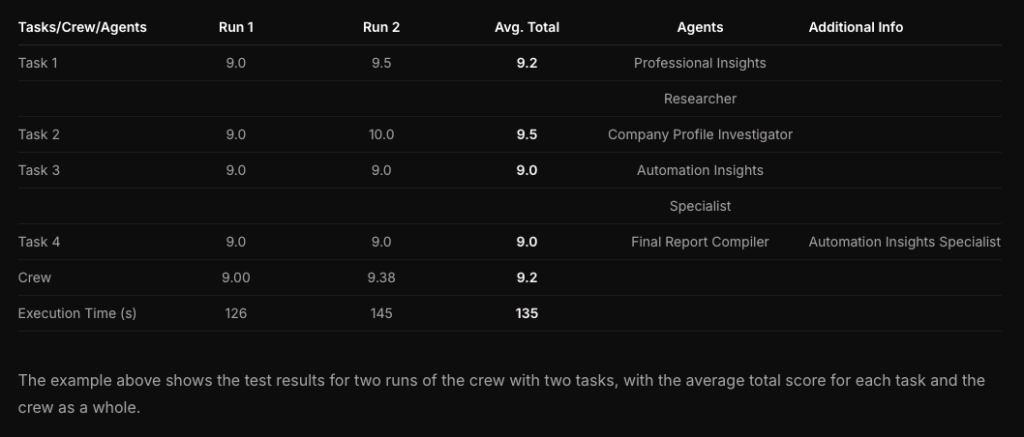
A typical workflow includes running the agent multiple times with the same test cases, applying LLM judges for subjective quality assessment, comparing outputs against gold standards, and aggregating results to identify patterns and issues.
Evaluation results inform iterative improvement. Teams can adjust agent instructions, refine prompts, modify tool configurations, or retrain components based on performance gaps. This continuous evaluation and refinement process is essential for maintaining reliable AI agent systems in production.
AI Agents Security
AI agents face unique security challenges that differ from traditional software vulnerabilities. As agents interact with users, access tools, and process data autonomously, they become targets for malicious attacks designed to manipulate their behavior or extract sensitive information.
Common Security Threats
Prompt Injection occurs when attackers craft inputs that override an agent’s original instructions, causing it to ignore safety guidelines or perform unintended actions. These attacks exploit the agent’s natural language interface to introduce malicious directives disguised as legitimate requests.
Tool Misuse happens when agents are manipulated into using their capabilities inappropriately—such as accessing unauthorized data, executing harmful commands, or making API calls that violate business rules. Since agents have direct access to tools and systems, compromised decision-making can have immediate consequences.
Data Poisoning involves corrupting the training data or knowledge bases that agents rely on, causing them to learn incorrect patterns or biased behaviors. Attackers may inject false information into retrieval systems or databases that agents query.
Context Poisoning targets the agent’s working memory by inserting misleading information into conversation history or retrieved documents. This can cause the agent to make decisions based on false premises or manipulated context.
Identity Spoofing exploits weak authentication mechanisms, allowing attackers to impersonate legitimate users or systems. Agents may then grant unauthorized access or perform actions on behalf of fake identities.
Security Countermeasures
Protecting AI agents requires multiple defensive layers. Input validation and sanitization filters suspicious patterns before they reach the agent’s core reasoning. Output monitoring detects when responses deviate from expected behavior or contain sensitive information leaks.
Tool access controls implement permission boundaries, ensuring agents can only invoke authorized functions with appropriate parameters. Context isolation separates user inputs from system instructions, making it harder for malicious prompts to override core directives.
Authentication and authorization frameworks verify user identities and enforce role-based access controls before agents process requests. Audit logging tracks all agent interactions, tool usage, and decision points for forensic analysis and compliance.
Adversarial testing proactively simulates attacks to identify vulnerabilities before deployment. Security-focused evaluation frameworks can test agent resilience against known attack patterns and edge cases.
Modern agent platforms are increasingly incorporating these security primitives as built-in features, but organizations must still configure them appropriately and maintain vigilance as new attack vectors emerge.
AI Agents Guardrails
AI agents operating autonomously in production environments require guardrails—protective boundaries that ensure safe, compliant, and aligned behavior. Unlike traditional software with hardcoded logic paths, agents make dynamic decisions that need real-time constraints to prevent harmful or inappropriate actions.
Types of Guardrails

Input Guardrails filter and validate incoming requests before they reach the agent’s reasoning engine. These prevent processing of prohibited content, malicious prompts, or queries outside the agent’s intended scope. Input guardrails can reject requests containing personal identifiable information (PII), offensive language, or topics the agent shouldn’t address.
Output Guardrails scan agent responses before delivery to users, blocking content that violates policies or quality standards. These catch hallucinations, inappropriate recommendations, leaked sensitive data, or responses that contradict business rules. Output guardrails ensure the agent doesn’t make unauthorized commitments or provide advice beyond its mandate.
Behavioral Guardrails constrain how agents use tools and make decisions during execution. These include spending limits on API calls, restrictions on which databases can be accessed, approval requirements for certain actions, and constraints on autonomous decision-making scope. For example, an agent might require human approval before financial transactions exceed a threshold.
Contextual Guardrails adapt constraints based on user roles, conversation context, or operational conditions. An agent might have different permissions for internal employees versus external customers, or operate under stricter rules during high-risk scenarios.
Implementation Approaches
Guardrails can be implemented through rule-based systems that enforce explicit policies, LLM-based classifiers that evaluate content against nuanced criteria, or hybrid approaches combining both. Modern agent frameworks provide guardrail APIs that intercept agent workflows at key checkpoints—before tool execution, after response generation, and during multi-step reasoning chains.
Effective guardrails balance safety with functionality. Overly restrictive guardrails frustrate users and limit agent utility, while insufficient guardrails expose organizations to risk. Continuous monitoring and adjustment ensure guardrails remain calibrated to organizational needs.
AI Agents Auditability
Auditability establishes transparency and accountability for AI agent operations. As agents make autonomous decisions that impact business outcomes, organizations need comprehensive records of what agents did, why they did it, and what information influenced their decisions.
Essential Audit Components
| Component | Why | What to capture? |
Decision Trails | Understand why an agent reached a particular conclusion or took a specific action. | Capture the agent’s reasoning process, including which tools were invoked, what information was retrieved, how the agent weighted different factors, and what alternatives were considered. |
Interaction Logs | To understand the complete context of each interaction, supporting compliance reviews, quality assurance, and issue resolution | All user inputs, agent outputs, and conversation flows.Logs should include timestamps, user identifiers, session metadata, and any relevant business context. |
Tool Usage Records | For security monitoring, cost management, and understanding the agent’s operational footprint across enterprise systems. | Document every external system call, API request, database query, and file access performed by the agent. |
Performance Metrics | Identify patterns that indicate degraded performance, emerging issues, or opportunities for improvement. | Track success rates, response times, error frequencies, and user satisfaction scores. |
Compliance and Governance
Auditability supports regulatory compliance by providing evidence of proper agent behavior. Industries with strict oversight—such as finance, healthcare, and legal services—require detailed records demonstrating that agents operated within approved parameters and didn’t make unauthorized decisions.
Audit data also enables retrospective analysis when issues arise. If an agent provides incorrect information or makes a problematic decision, audit trails allow teams to reconstruct the event, identify root causes, and implement corrective measures.
Implementation Considerations
Effective audit systems must balance comprehensiveness with storage and privacy concerns. Logs should capture sufficient detail for meaningful analysis while protecting sensitive information. Retention policies should align with regulatory requirements and business needs.
Modern agent platforms provide structured logging frameworks that automatically capture key events in standardized formats. Organizations should integrate these logs with existing observability and compliance systems, enabling centralized monitoring and analysis across all AI agent deployments.
Conclusion
AI agents represent a fundamental shift in how enterprises deliver value—moving from deterministic software to autonomous systems that reason, decide, and act on behalf of organizations. This power comes with responsibility. Without robust governance, agents can make costly mistakes, expose sensitive data, violate policies, or erode user trust.
The four governance pillars—evaluation, security, guardrails, and auditability—form an integrated framework for deploying AI agents safely and effectively in production environments.
Evaluation ensures agents perform reliably despite their non-deterministic nature, combining subjective LLM-based assessment with objective benchmarking to validate quality before and after deployment.
Security protects against emerging threats unique to AI systems, from prompt injection to identity spoofing, implementing defensive layers that safeguard both the agent and the systems it accesses.
Guardrails establish boundaries that keep agents aligned with organizational policies and ethical standards, constraining behavior without sacrificing the flexibility that makes agents valuable.
Auditability provides transparency into agent operations, creating decision trails that support compliance, enable root cause analysis, and build stakeholder confidence in autonomous systems.
Together, these pillars transform AI agents from experimental prototypes into trustworthy enterprise tools. Organizations that invest in governance upfront accelerate adoption, reduce risk, and unlock the full potential of AI agents to drive business value. As agents become more capable and autonomous, governance won’t be optional—it will be the foundation of successful AI implementation.