Have you ever wondered how ChatGPT or other AI chatbots can write stories, answer questions, and have conversations with you? Let me explain it in a way that’s easy to understand!
The Magic Black Box
Imagine a large language model (LLM) as a mysterious black box. You type something into it (like a question or a story prompt), and it gives you text back as an answer. Simple, right? But what’s happening inside?
Before we peek inside, here’s something important: this black box has been “trained” by reading millions and millions of books, websites, and articles. Think of it like a student who has read every book in the world’s biggest library! All that reading becomes the LLM’s vocabulary and reference material.
Now, let’s open up that black box and see what’s really going on inside.
Inside the Black Box: Three Important Parts
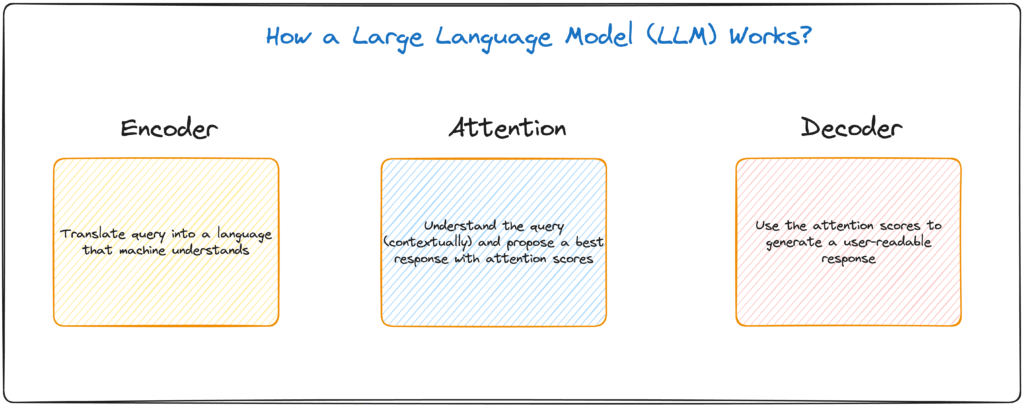
When we look inside, we actually find three smaller boxes working together:
- The Encoder – The Translator
- The Attention Mechanism – The Detective
- The Decoder – The Writer
Let’s explore each one!
Part 1: The Encoder (The Translator)
The Encoder’s job is to translate your words into a language that computers understand: numbers!
Step 1: Making Tokens – First, your sentence gets broken into pieces called “tokens.” These are like puzzle pieces made of words or parts of words. Each token gets assigned a number. For example:
- “apple” might become token #5234
- “car” might become token #891
Step 2: Creating a Meaning Map – But here’s where it gets cool! The Encoder doesn’t just turn words into random numbers. It places them on a special map called a “vector embedding.” This map shows how words relate to each other based on their meaning.
Imagine a huge playground where similar words stand close to each other:
- The word “apple” would stand near “fruit,” “orange,” and “banana”
- It would also stand somewhat near “computer” (because of Apple computers)
- But it would be really far away from “car” or “rocket”
This map helps the LLM understand that words can have similar meanings or be used in similar ways.
Part 2: The Attention Mechanism (The Detective)
This is where the real magic happens! The Attention Mechanism is like a detective trying to figure out what you really mean.
Understanding Context Let’s say you type: “The bat flew out of the cave.”
The word “bat” could mean:
- A flying animal, OR
- A baseball bat
The Attention Mechanism’s job is to figure out which meaning you’re talking about by looking at the other words around it. When it sees “flew” and “cave,” it realizes you’re probably talking about the animal!
How Does It Do This?
The Attention Mechanism uses something called Multi-Head Attention. Instead of looking at one word at a time, it looks at groups of words together to understand the full picture.
Think of it like this: If you’re trying to understand a painting, you don’t just look at one tiny spot. You step back and look at different parts of it from different angles. That’s what multi-head attention does with your sentence!
The Scoring Game: Q-K-V
Here’s how the detective assigns importance scores to words:
- Query (Q): “What am I looking for?” – This is your input word asking a question
- Key (K): “What do I know?” – This is the relevant information from the LLM’s huge knowledge base
- Value (V): “How important is this?” – This is the score that tells the LLM which words matter most
For our bat example, the word “flew” would get a high score because it’s super important for understanding that we’re talking about the animal, not the baseball bat!
The Feed-Forward Network
After scoring all the words, something called a Feed-Forward Neural Network (FFN) steps in. Think of it as a teacher organizing messy notes into a clean outline. It takes all those scores and organizes them neatly.
This whole process—the scoring and organizing—repeats several times to make sure the LLM really, really understands what you’re asking. Each time through, the understanding gets sharper and clearer.
Part 3: The Decoder (The Writer)
Now that the LLM understands what you’re asking, it’s time to create an answer! That’s the Decoder’s job.
Finding the Best Word
The Decoder looks at all the attention scores and context, then asks: “What’s the best word to say next?”
It searches through its vocabulary and calculates probabilities. For example, if you asked “What color is the sky?” the Decoder might find:
- “blue” has a 70% probability
- “gray” has a 15% probability
- “pizza” has a 0.001% probability (doesn’t make sense!)
The Decoder picks the word with the highest probability—in this case, “blue.”
Building Sentences Word by Word
Here’s something cool: the LLM doesn’t write the whole answer at once. It writes one word at a time, super fast!
After it writes “blue,” it asks again: “What should the next word be?” Maybe it adds “and” or “on” or “during.” Each word it picks becomes part of the context for choosing the next word.
This keeps going—pick a word, add it to the response, pick the next word—until the full answer is complete.
Back to Human Language
Remember how we turned your words into numbers at the beginning? Well, the Decoder does the opposite at the end! It takes all those number tokens and converts them back into words you can read.
And voila! You get your answer!
Putting It All Together
Let’s see the whole process with an example:
You type: “What do cats like to eat?”
- Encoder: Converts your question into tokens and places them on the meaning map. It knows “cats” are near “pets” and “animals,” and “eat” is near “food” and “hungry.”
- Attention Mechanism: The detective analyzes the question and realizes the important words are “cats” and “eat.” It assigns high scores to these words and understands you’re asking about cat food.
- Decoder: Looks at the context and starts writing: “Cats” (highest probability first word) → “like” (next best word) → “to” → “eat” → “fish,” → “chicken,” → “and” → “cat” → “food.”
Each word gets converted back from numbers to text, and you see the complete answer appear on your screen!
The Speed of Thought
All of this—the encoding, the attention detective work, the decoding—happens in just seconds or even split seconds! The LLM processes your input through these three stages so quickly that it feels like magic.
But now you know the secret: it’s not magic. It’s a clever system of translating, understanding context, and finding the most likely words to respond with, all powered by the massive amount of reading the LLM did during its training.
Remember the Key Ideas
- LLMs are like super-readers who’ve read millions of books and can use that knowledge to chat with you
- The Encoder turns your words into numbers and maps their meanings
- The Attention Mechanism is a detective figuring out what you really mean
- The Decoder picks the best words one by one to answer you
- Everything happens lightning-fast, even though there are many steps!
Now you know how an LLM works! Pretty cool, right? Next time you chat with an AI, you’ll know exactly what’s happening behind the scenes.