• Skip to primary navigation
  • Skip to main content
  • Skip to primary sidebar

Meet Ashwin

Helping Engineers To Become Tech Leaders

  • Blog
  • Newsletter
  • Courses
    • Generative AI 101
  • Products
    • 8 Mistakes to avoid in Tech Leadership (e-book)
  • Resources
  • Contact

Leadership

Understand your Stakeholders with a Stakeholder Map

June 1, 2024 by Ashwin Leave a Comment

Understanding your stakeholders is essential for any project’s success. Stakeholder maps offer a visual way to make it happen.

Who is a Stakeholder?

A stakeholder is someone who has a vested interest in the outcome of a project or a program.

Not all stakeholders are the same.

They come with a variety of needs and expectations.

As a tech leader, you must:

  1. Identify them
  2. Analyze and learn about them
  3. Map them based on their interests
  4. Prioritize and manage

One useful tool to do this is a stakeholder map.

What is a Stakeholder Map?

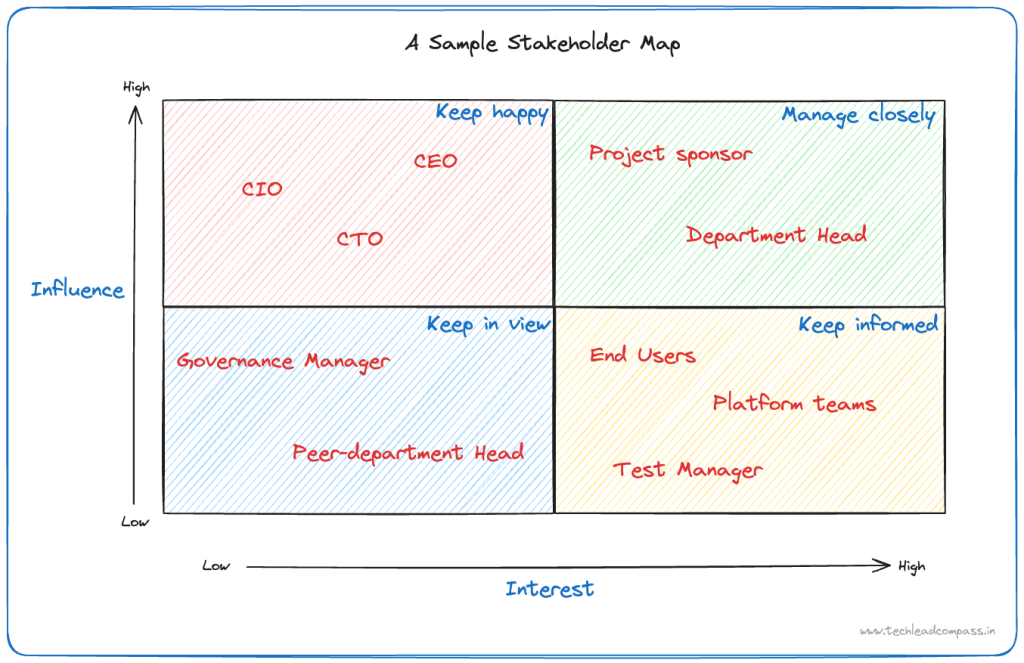
A stakeholder map is a visual matrix that identifies and categorizes stakeholders based on 2 dimensions – influence and interest.

Influence is the degree to which a particular stakeholder can impact the execution and outcome of a project. For example, a project sponsor is someone with a high influence, who can drive key decisions.

Interest, on the other hand, is about how much a stakeholder is impacted by the project outcome. For example, if you are building an HR application, the end-users in the HR team have high levels of interest.

Once you have established this, the stakeholders can be mapped on a matrix.

  1. High influence, High interest – stakeholders that must be managed closely, as they can steer the direction and outcome of the project
  2. High influence, Low interest – these are key leaders in the organization who may not be directly interested in the outcome of the project, but must be kept happy (no escalations, firefighting, etc.)
  3. Low influence, High interest – these are folks usually part of the project team or the intended end-users. They have a high interest as the outcome with have a direct impact on them but often their influence is limited
  4. Low influence, Low interest – these are enablers or other enterprise bodies, who are not directly involved in the execution or outcome. But they may expect to be “kept in the loop”

Here’s a sample stakeholder map for a project. Do note the categorization is highly opinionated, it can vary for every project or initiative.

A sample stakeholder map

How do you create a Stakeholder map?

There is no single way to create a stakeholder map and it highly depends on your organization’s culture and operations.

However, here is a 5-step blueprint that works in most cases.

  1. Start with the purpose of your map
  2. Brainstorm and build the stakeholder list
  3. Determine each stakeholder’s level of involvement
  4. Determine their interest and goals in the project
  5. Create a stakeholder map and establish an engagement plan

In summary, a stakeholder map helps you understand the landscape, know the stakeholder interests, and create an engagement plan that works.

Filed Under: Leadership, Stakeholders, Tech Tagged With: stakeholder, stakeholder management, tech, techleadership

How To Create Status Reports That Work?

May 11, 2024 by Ashwin Leave a Comment

Status reports that work

Status reports are often the most “filtered out” emails, ending up in a folder that never gets opened. But that doesn’t mean the stakeholders are not interested in the status… they just hate the way it is reported!

3-Speed Status Reports

From my experience across a wide range of stakeholders, information is often expected at 3 different speeds.

  1. On-demand (fast) – get the information when they need it, without having to contact anybody
  2. Concise (slow) – get them the information in a way they can easily digest
  3. Details as needed (slowest) – they can go into finer details as needed

Often, preference is given to #1 or #2, with #3 being used for information that they care about (e.g., a big failure or escalation)

About 80-85% of stakeholder expectations are addressed by one of these 3 modes.

As someone responsible for reporting status, like a project manager, it becomes important to address these modes.

How do you do that?

The Reporting Sweet Spot!

Here’s a recommendation that works with most. However, you must understand the expectations and tailor them for any specific needs.

Status reports that work

3 recommended ways to report information that is proven to work are:

  1. Information radiators / Dashboards – on-demand, single-page view of status and visualization of key metrics
  2. TLDR Summary – a condensed summary of not more than 6 bullet points that highlight important aspects and key messages
  3. Double-click Reports – a detailed report, not more than 2 pages, that has a double-click of key messages in the TLDR summary

Also, include a specific section that calls out actions for the stakeholder – it can be an approval or have them enable a smooth progress.

Here’s a sample email structure that you can use – covering all of the above:

Sample email status report

I hope these tips help you make the status reports useful, once again! Cheers…

Filed Under: Leadership, Reporting, Tech Tagged With: leadership, management, project management, projects, status reports, tech

Become a Better Decision Maker

April 27, 2024 by Ashwin Leave a Comment

Decision Making

As a tech leader, you’ll make decisions multiple times daily. Some of these can be simple decisions and others more impactful.

Leadership decisions impact everyone working in your team, so it is critical that you have proven tools in your arsenal.

There are two effective decision-making tools.

  1. Decision matrix
  2. Decision trees

Let’s start with the first one.

#1 Decision Matrix

A decision matrix is a decision-making table you can use to evaluate different options

It is a fairly straightforward tool when you have a set of choices and criteria to evaluate them.

How to create a decision matrix?

  • Define your goal or problem statement
  • Make a list of options
  • Define the criteria against which each option must be evaluated
  • Assign weights to each criterion based on their importance (higher weight refers to higher importance)
  • Score each option against every criterion (thus creating a table or matrix)
  • Calculated weighted score for each option (by multiplying raw score with the weight for each entry)
  • Compare the total weighted score for options

The option with the highest weighted score is most probably the better decision to go with.

Here’s a sample decision matrix.

However, a decision matrix is not very useful when the options or criteria have relationships between them.

For example, a criterion might be more important when combined with another one and not otherwise.

That’s when you need to use a decision tree.

#2 Decision tree

A decision tree is a map of the possible outcomes of a series of related choices.

A decision tree has 3 components:

  • A decision node represents a decision to be made (typically represented as squares)
  • A chance node shows the probability of certain results (typically represented as circles)
  • An end node shows the outcome of a given path (typically represented as triangles)

Here’s a fairly simple decision tree that helps you decide what to do on a given day.

A trivial decision tree (https://www.lucidchart.com/pages/decision-tree)

How to draw a decision tree:

  1. Start with the major decision to be made (e.g., buy a house or not)
  2. Add chance and decision nodes to expand the tree
  3. Include the probability and the cost of each option, to make a numerical decision
  4. Continue to expand until each line reaches an end
  5. Calculate the expected value (EV) of each line. The one with the highest EV is the better path to take

Here’s an example decision tree for a company deciding on “what app to build next”.

A more complex decision tree (https://www.lucidchart.com/pages/decision-tree)

In the above example:

  • A company has to choose between 3 choices as their next app to build
    • Build a gaming app (costing $75k)
    • Build a productivity app (costing $50k)
    • Revamp existing app (costing $30k)
  • For each of these choices, there are forecasted revenues and the probability of achieving them
  • Expected value (EV) of revenue is the probabilistic sum of all choices in the path and the cost

Here’s an excellent article from Lucidchart on how to draw a decision tree.

One drawback is that decision trees can become more complex as you add more choices and probabilities. That’s when something like an influence diagram helps – but we will reserve it for another day.

Hopefully, this post has given you some solid tools for your next big decision.

Filed Under: Leadership, Tech Tagged With: decisionmaking, decisions, leader, leadership, tech

Primary Sidebar

Connect with me on

  • GitHub
  • LinkedIn
  • Twitter

Recent Posts

  • The Evolution of Data Platforms : Beyond Data Lakehouses
  • Book review : The Almanack of Naval Ravikant
  • Communicate your Software Design better with C4 Model
  • Understand your Stakeholders with a Stakeholder Map
  • How To Create Status Reports That Work?
  • Topics

    • Life
      • Leadership
      • Negotiations
      • Personal Finance
      • Productivity
      • Reading
      • Self Improvement
    • Post Series
      • Intro to Blockchain
    • Tech
      • AI
      • Blockchain
      • Career
      • Certifications
      • Cloud
      • Data
      • Enterprise
      • Leadership
      • Presentations
      • Reporting
      • Software Design
      • Stakeholders

Top Posts

  • Understanding the Paradigm of AI Tools, Apps and Agents
  • Create your first Application Load Balancer (ALB) in AWS
  • A Framework to Acing Your Next Tech Presentation
  • What is Blockchain and Why do we need it?
  • Event-driven Systems

Copyright © 2025 · Ashwin Chandrasekaran · WordPress · Log in
All work on this website is licensed under a Creative Commons Attribution-ShareAlike 4.0 International License
The views and opinions expressed in this website are those of the author and do not necessarily reflect the views or positions of the organization he is employed with

  • 🚀 I just launched a free course to learn Generative AI Fundamentals on Udemy! 🚀Enroll now